 FairSupply · 2023 · Full case article
From impenetrable to indispensable.
FairSupply turns years of mathematical and legal research into an ESG platform anyone can use, without dumbing it down. As the first and only Product Designer, I led strategy, IA, UX, UI, research and a design system built from the new brand.
- RoleProduct Designer, first and only
- ScopeStrategy, IA, UX, UI, research, design system
- ProductB2B SaaS, ESG risk intelligence
- Year2023
Powerful data. Overwhelming interface.
From supplier names and spend alone, FairSupply maps ESG risk ten tiers deep into a company’s supply chain. The data was exceptional, but the UI was built around the data model, not the user.
The goal: make it usable without an ESG degree, as the company moved from consultancy to B2B SaaS.
“Using it required not only a stiff drink but also an in-depth knowledge of ESG.”
FairSupply team member
Make it accessible, without making it shallow.
Help newcomers understand their exposure. Give experts the depth they need. Communicate uncomfortable findings without panic. Present uncertainty honestly, without eroding confidence.
Blue ocean, no playbook
No direct competitors in Australia at the time, and low familiarity with ESG tooling. User education had to live inside the product.
Validate fast, in moving parts
Product strategy was still evolving while design was underway. Assumptions were formed and tested in parallel with strategic shifts.
Systems before stability
The design system had to work before the product stabilised: foundations that wouldn’t be rebuilt every quarter.
I worked across product strategy, IA, UX, UI, research and design system infrastructure, with founders, PMs, engineers, PhDs and ESG specialists, while helping establish a culture of validation and iteration in an organisation that hadn’t had design leadership before.
The rules we set before touching a pixel.
Locked in with leadership before any screen was designed. Not aesthetic preferences: strategic commitments every downstream decision had to respect.
Data first
Data is the product. Every layout decision prioritises legibility over decoration.
Progressive disclosure
Summary views for newcomers, full depth for experts. No hiding, no overwhelming.
Robust grid
A disciplined grid keeps thousands of data structures consistent, never improvised.
Colour = signal
Colour is reserved for data. The UI itself is near-monochrome, so every colour carries meaning.
Transparency builds trust
ESG data involves estimates and uncertainty, communicated honestly, without undermining trust.
Guided actions
Every insight surfaces a clear next step. Actionability is what prevents churn.
Three calls that shaped the product.
Each one weighed accessibility against depth, and was made against evidence from the existing product and from testing.
Simplify, or disclose progressively?

Top bar, sidebar or icon rail?
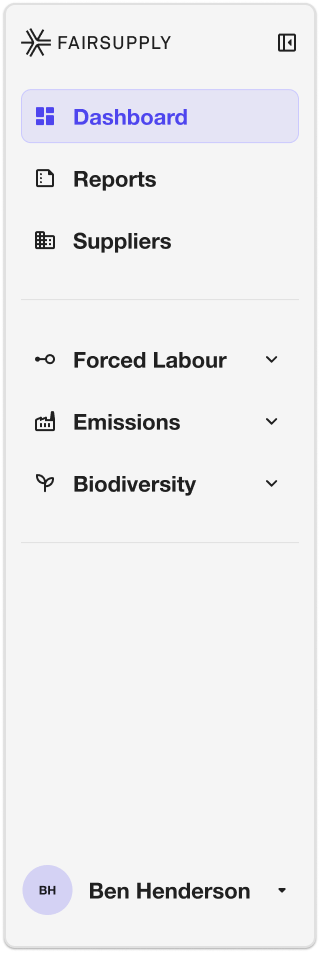
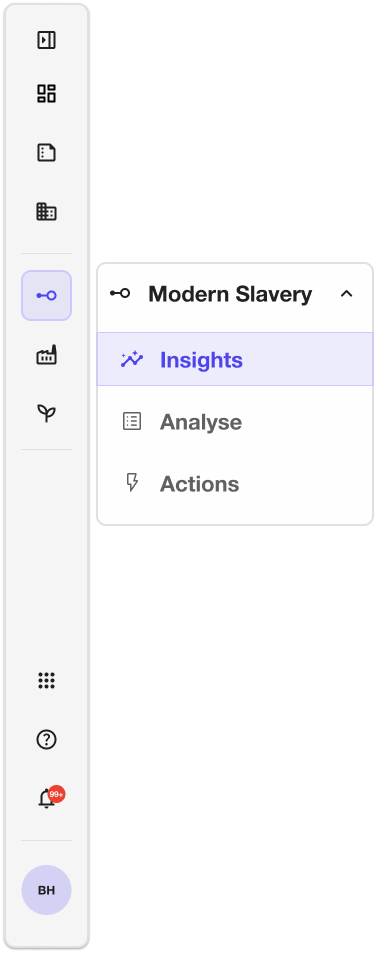
Brand colour, or colour as signal?


Structure first, then the UI.
Wireframing kept visual decisions out of structural conversations, and structural decisions out of visual explorations.
Product audit
Every screen, flow and data structure mapped.
IA restructure
Three risk categories, each with Insights / Analyse / Actions.
Low-fi wireframes
Layout and hierarchy aligned before any brand decisions.
Brand translation
The new brand applied to the structures; the system built in parallel.
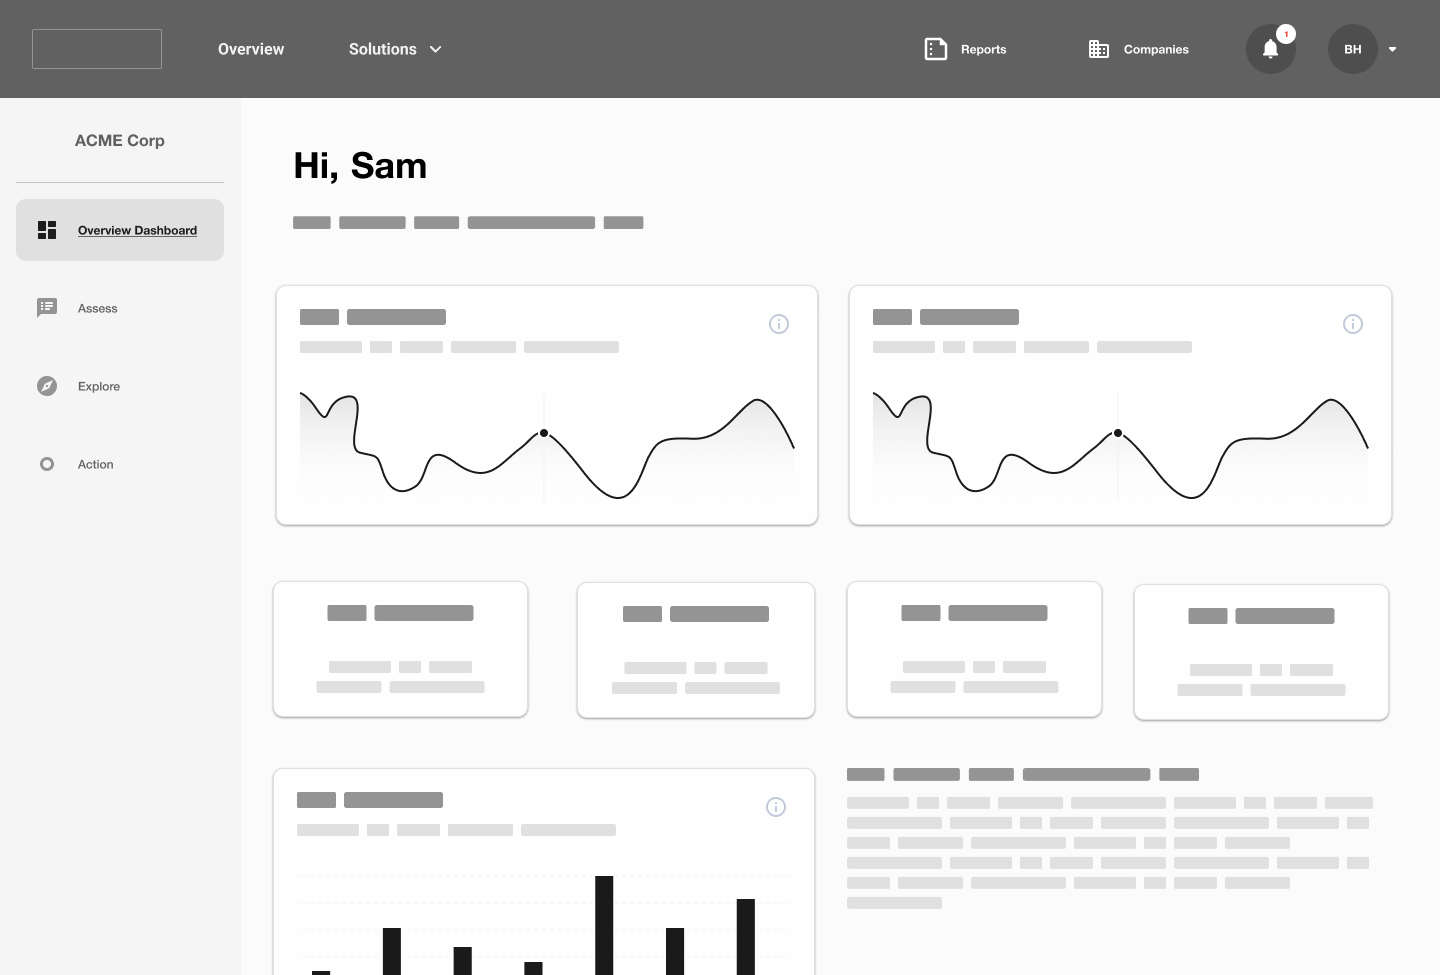
Navigation is the product.
The old flat top bar mixed modules and features; users couldn’t tell where they were. The redesign inverted it: a persistent sidebar organised by risk module, each with the same three sub-pages.
“I’m in Forced Labour, looking at Insights,” not “I’m in Assess, filtered to Modern Slavery.”
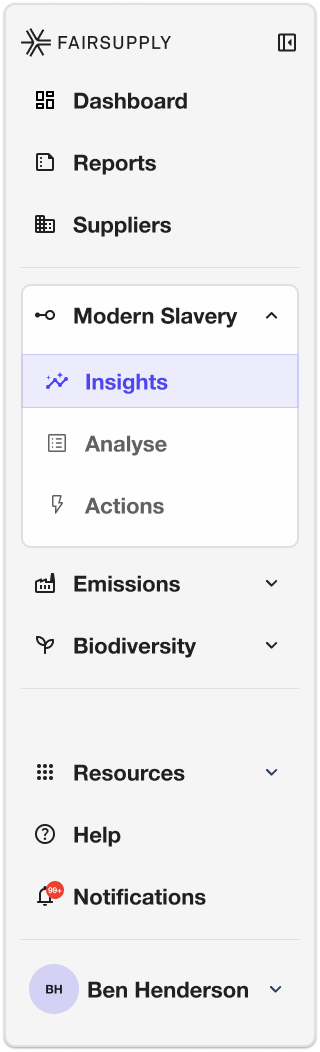
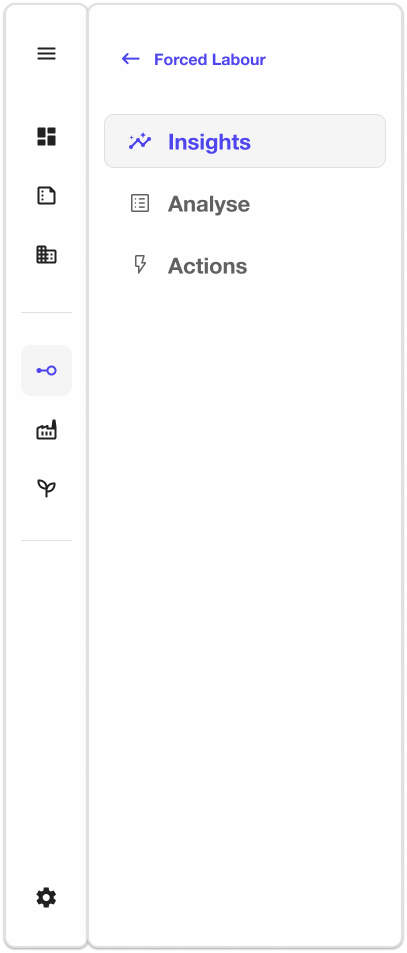
Can a new user find where they need to go without explanation?
From exposure to action.
One path through each risk module, not isolated dashboards. Assess, understand, act: every view ends in a next step.
See exposure.
Forced labour risk, material and industry risk, and the trend against the industry benchmark, at a glance.
Shipped · Live productUnderstand why.
Suppliers ranked, with risk traced by tier and country, and the riskiest tier opened in a side panel.
Compare.
Every report benchmarked against past assessments and the industry, so a score always has context.

From spend to Scope 3.
The footprint, estimated from spend and refined with supplier-reported figures.
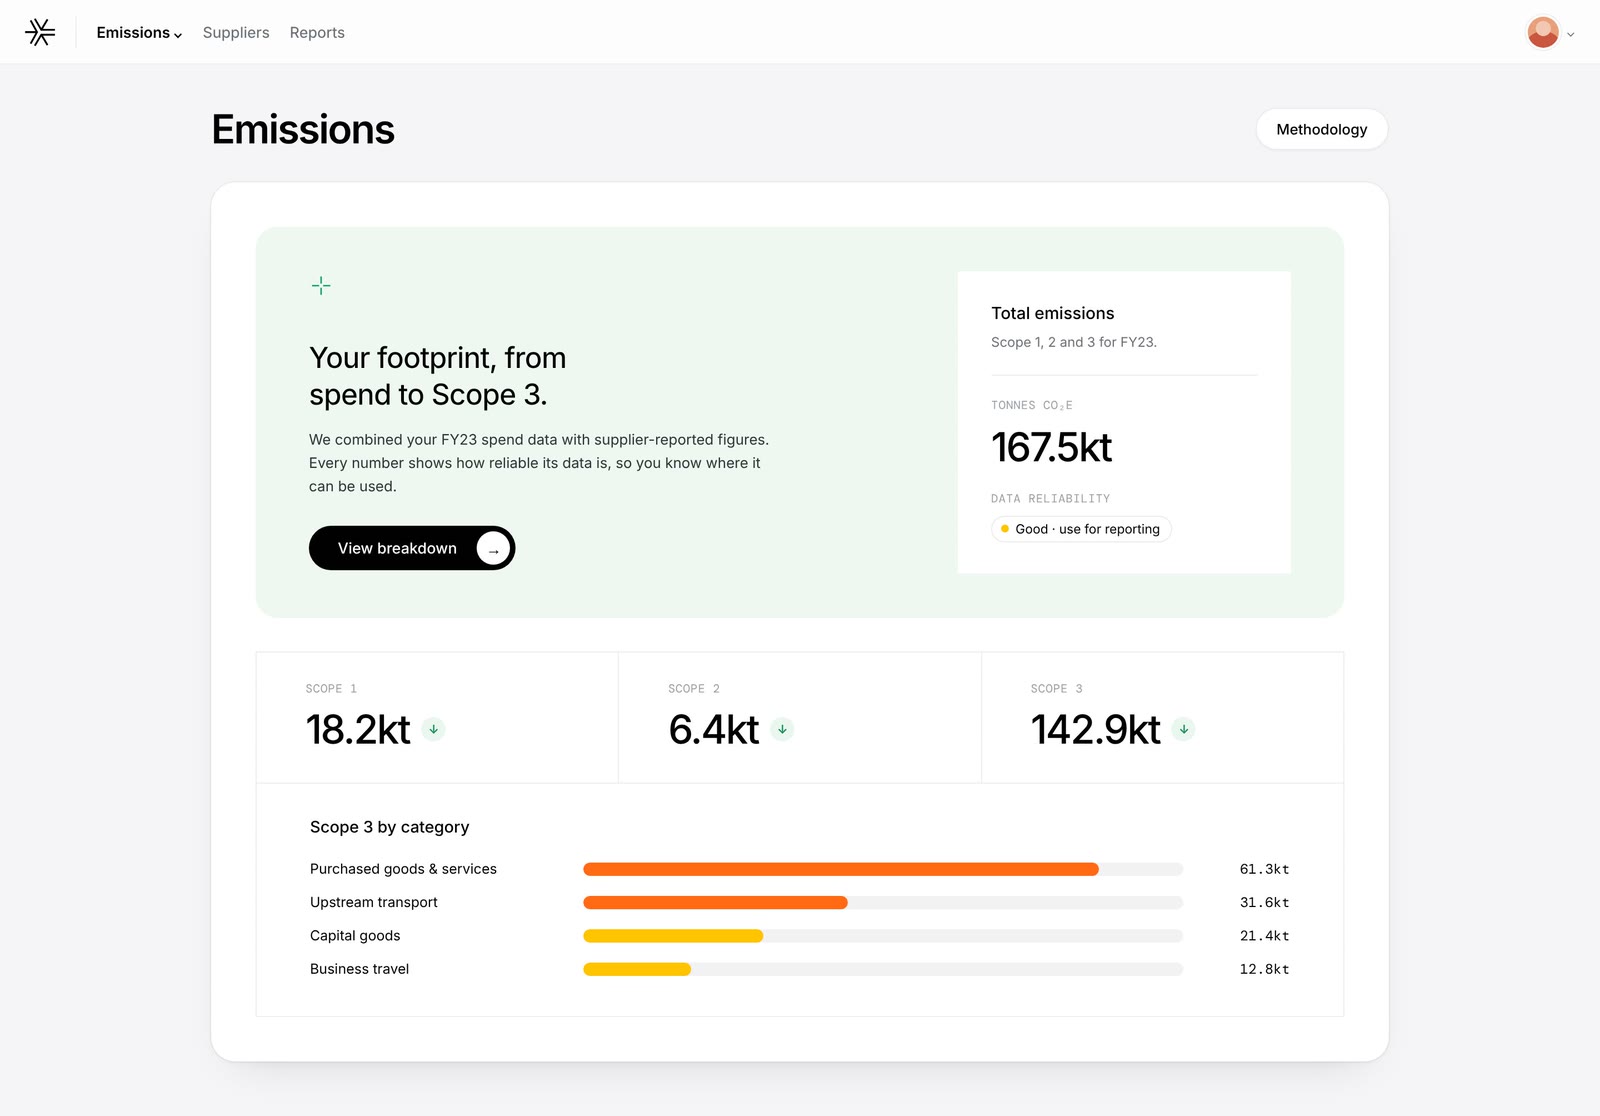
Statements, section by section.
A Modern Slavery Statement, put together step by step from the data already in the platform.
Guided actions across the flow: every insight surfaces its next step.
Ask anything, with sources.
An AI assistant embedded in the product, answering ESG questions in context, surfacing legislation and explaining risk calculations.
Designing it meant solving for trust as much as functionality: ESG answers carry regulatory and reputational weight. The tone is calm and informational, like talking to a knowledgeable colleague, not a chatbot, because forced labour exposure can be anxiety-inducing.
States designed: empty · loading · answer with disclaimer.
Black, white and exactly one purple.
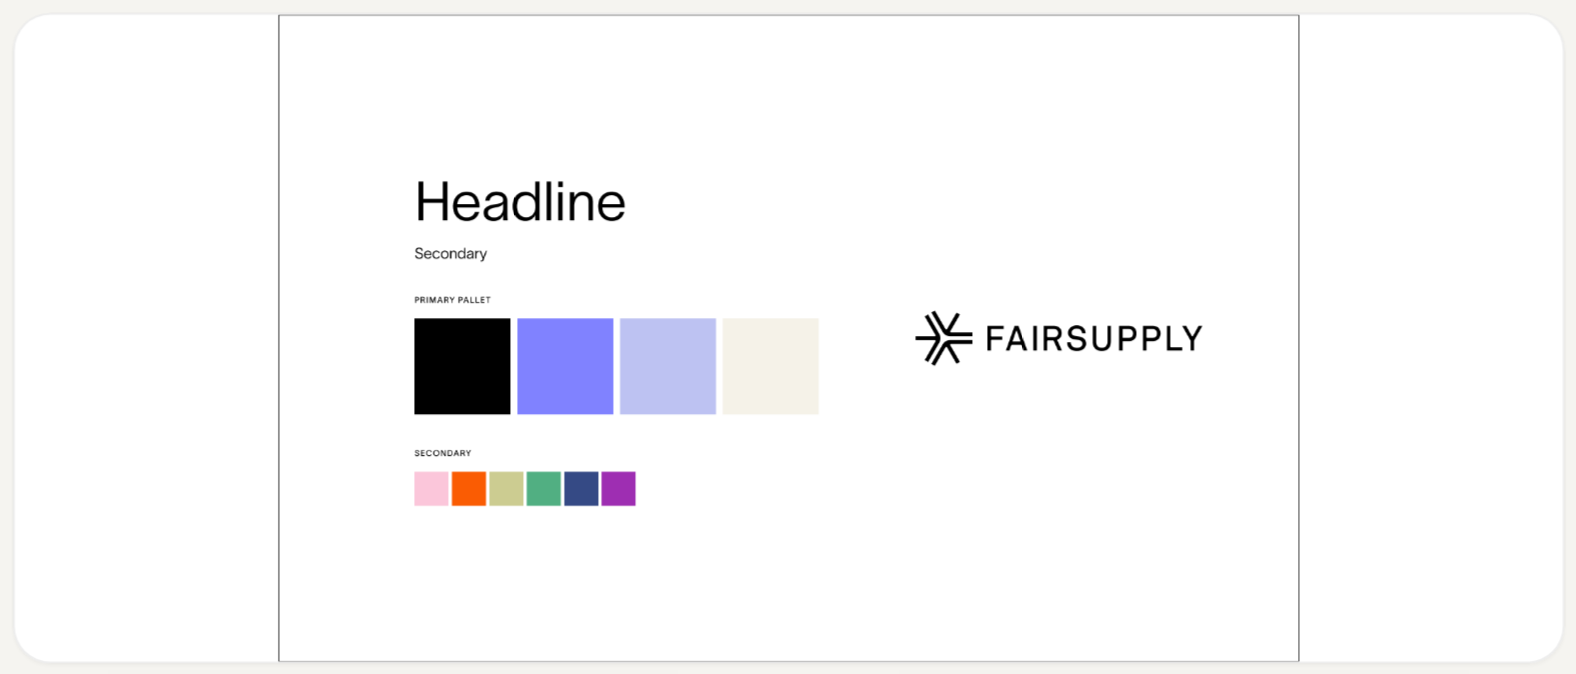
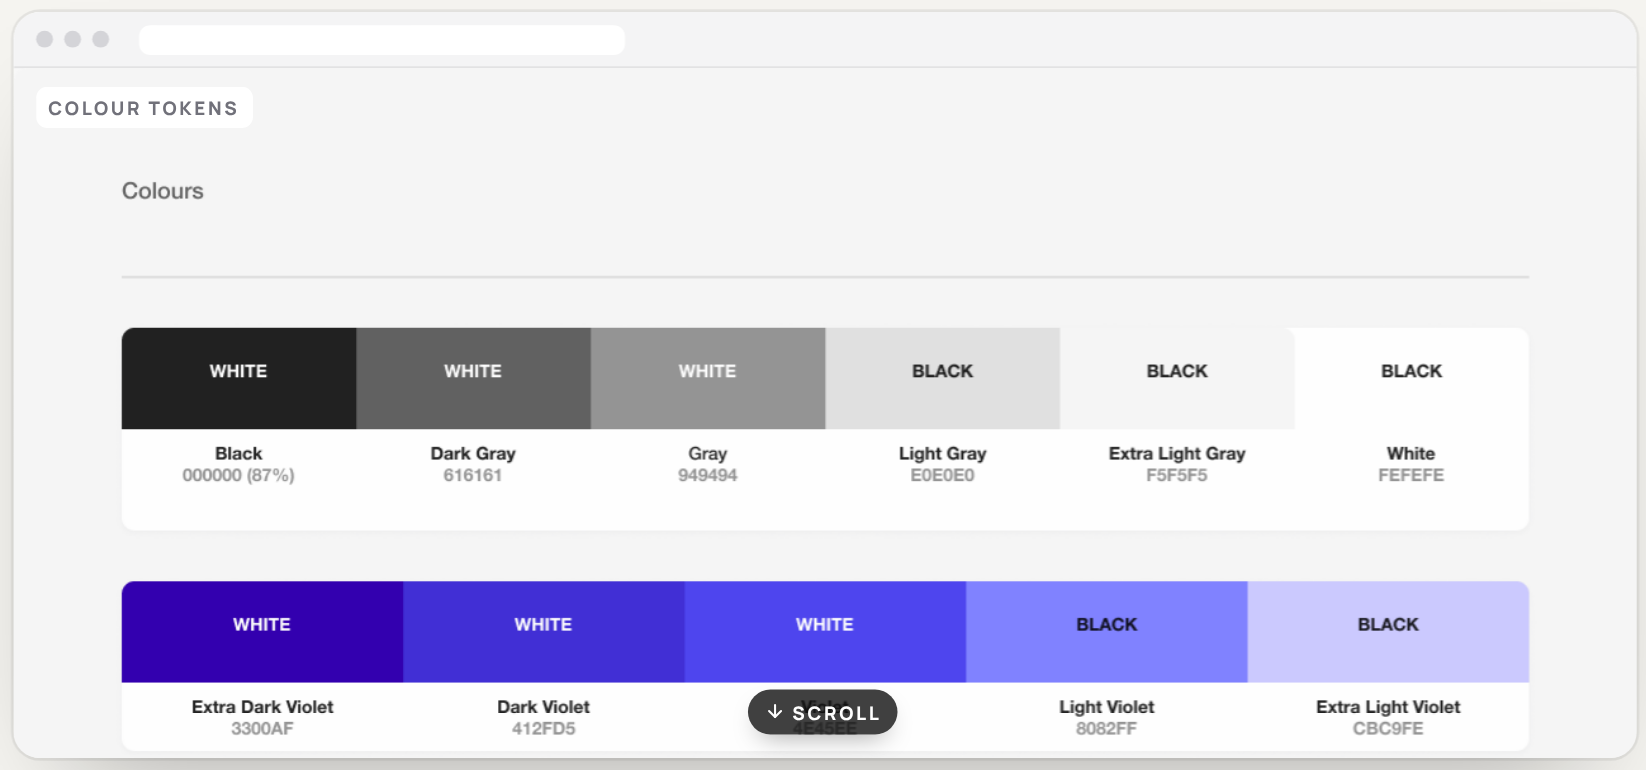
The rebrand by For Good Design Lab gave us a near-monochrome palette with purple as the sole accent. The redesign reduced purple to its essential roles (active navigation, primary CTAs and brand moments), so colour everywhere else could finally communicate.
It took three rounds of look tests to balance brand presence with data legibility.
The system that made scale possible.
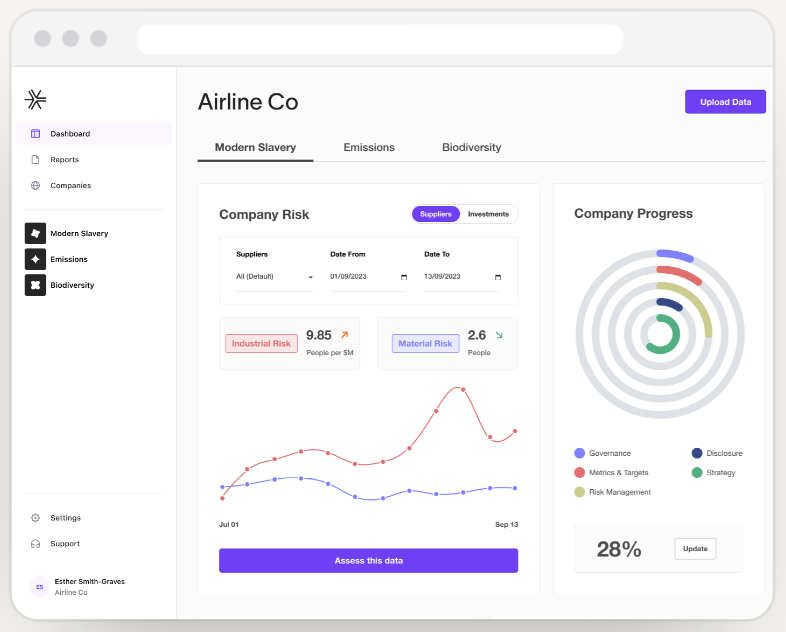
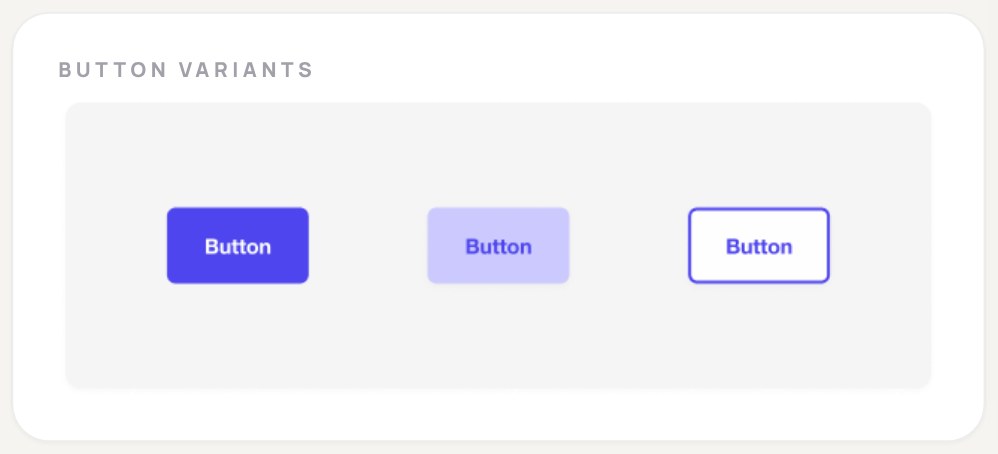
Supplier tables with 50+ columns, six-segment risk bars, KPI grids: none of it can be designed screen by screen. Tokens, components, spacing rules and data-viz patterns, mapped to TypeScript constants for engineering.
#DC2626High moderate #EA580CModerate #F59E0BModerate low #84CC16Low risk #22C55EUncategorised #D1D5DB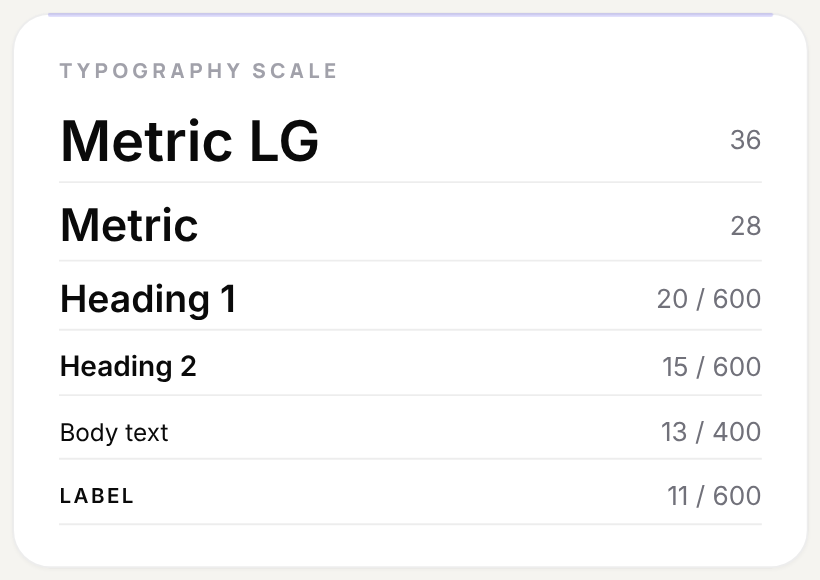
A platform that earns trust by being honest.
Active risk monitoring, not periodic audits. Before the redesign, customers came back about twice per semester, only for compliance cycles.
Per semester before: compliance cycles only.
After: risk monitored continuously, not once a cycle.
Customer base and adoption grew substantially.
Customer and revenue figures are protected.
Process, validation culture and product practices built from the ground up
From nothing to a documented token and component library
Forced Labour, Carbon and Biodiversity, redesigned end to end
Mapped automatically
The first in the product
What this reinforced.
Building the table.
Being the first designer means every decision requires judgement about what will matter for the product’s future. It’s building the table while everyone’s already sitting at it.
Experts change the brief.
Working alongside environmental PhDs, legal experts and economists changes how you understand what’s actually worth designing.
Complexity, made navigable.
The hardest challenge isn’t simplification. The job wasn’t to sand the product down; it was to build the structure to reach any level of detail.
In compliance and regulatory contexts, how you present data is the product.

Thanks for reading. Next up: NerdWallet.
Modernising how people match with a financial advisor: a funnel rebuilt mobile-first, validated with A/B tests and interviews, +27% leads.